RX 9070 GRE review: Game benchmarks and performance index
Gaming performance, part 1, rasterization: How fast is the Radeon RX 9070 GRE compared with other graphics cards?
Inhaltsverzeichnis
- Page 1 Overview and specifications
- Page 2 Game benchmarks and performance index
- Page 3 Ray tracing benchmarks and performance index
- Page 4 Path tracing benchmarks and performance index
- Page 5 Power consumption and efficiency
- Page 6 Price-performance ratio in rasterization & ray tracing, & conclusion
- Page 7 Image gallery
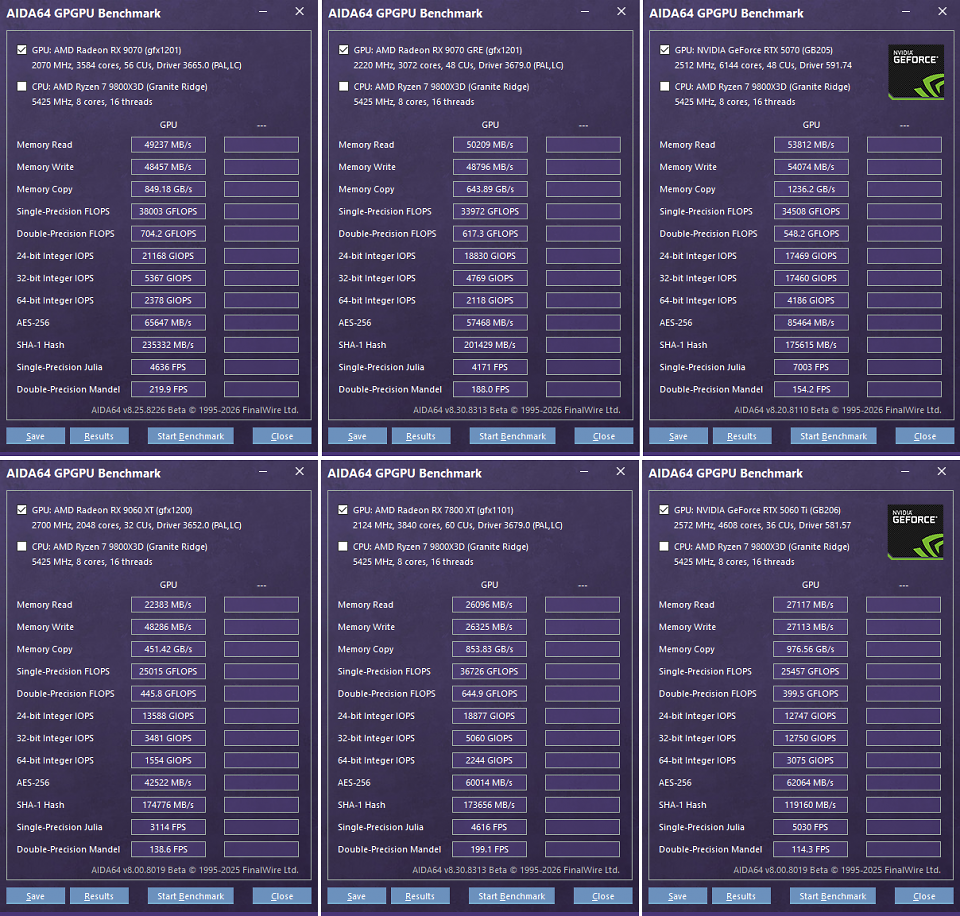
How does AMD's Radeon RX 9070 GRE fare in rasterized games, modern ray tracing showpieces, and pioneering path tracing titles? To answer that question, we put AMD's latest graphics card through our 2026 GPU benchmarks. The 20 rasterization tests, 15 ray tracing tests, and 8 path tracing tests produce highly interesting results. A first overview of throughput rates, meanwhile, is provided by AIDA64's General Purpose GPU Benchmark, helping to better assess the test candidates:
 Source: PC Games Hardware
RX 9070 vs. RX 9070 GRE vs. RTX 5070 vs. RX 9060 XT 16GB vs. RX 7800 XT vs. RTX 5060 Ti 16GB
Source: PC Games Hardware
RX 9070 vs. RX 9070 GRE vs. RTX 5070 vs. RX 9060 XT 16GB vs. RX 7800 XT vs. RTX 5060 Ti 16GB
GPU benchmarks 2026
What we also test: Every published figure represents the average of three, in some cases four runs per resolution; outliers are not included. That means at least twelve measurements per game, or 240 per graphics card for the rasterization performance index alone. In other words: The benchmarks show you an aggregate of more than 15,000 individual measurements.
Since the GPU clock speed of one and the same card varies during testing, we report the average clock across all resolutions, calculated by our measurement tool CapFrameX. If a graphics card operates at dynamic frequencies between 2,700 and 2,900 MHz, for example, this results in a figure of "~2.80 GHz." As a rule of thumb: If the graphics card is the limiting factor and therefore solely determines the frame rate, GPU boost decreases as the resolution increases.
Radeon RX 9070 GRE: Game benchmarks
For our Radeon RX 9070 GRE review, we present the full set of measured results. As usual, you can choose between four resolutions: Full HD, WQHD, Ultrawide QHD, and Ultra HD, which can be selected for each game using the grey drop-down menu on the left. This time, WQHD (2,560 × 1,440 pixels) is shown by default, matching the compute power of our test candidate. Important: The 2026 rasterization benchmarks are also carried out consistently at native resolution, without any form of upsampling. This not only addresses numerous requests from readers and viewers, but also enables us to highlight the performance differences between graphics cards as clearly as possible. If you play with upsampling, generally higher frame rates can be expected. Those playing in Ultra HD with quality upsampling, for example, can use the WQHD figures shown here as a useful point of reference (overview of the internal resolutions resulting from upsampling). That is enough preamble. Here are the rasterization results:
If wanted, you can enable up to 19 additional graphics cards for each game, which we have hidden for the sake of clarity.
Take a Radeon RX 9070, remove a few parts, and the result is the RX 9070 GRE. The latest "Great Radeon Edition" performs exactly as one would expect. The Radeon RX 9060 XT has no chance due to its significantly lower raw performance. Instead, the RX 9070 GRE consistently stays close behind the RX 9070 without ever catching it, as that is impossible given the hardware. A lack of memory is practically not an issue; 12 GiByte of memory is sufficient for pure rasterization in almost all cases. Only the most demanding games reveal the RX 9070 GRE's limits in Ultra HD, such as Stalker 2. In WQHD, the Geforce RTX 5070 wins 17 out of 20 duels against the Radeon RX 9070 GRE, while the RX 9070 generally pulls ahead of both. For additional results, including Ghost of Tsushima, Horizon Forbidden West, Hellblade 2, and Hunt: Showdown, please refer to our first review of the Radeon RX 9070 GRE.
Radeon RX 9070 GRE in the performance indes
Where does the Radeon RX 9070 GRE land in the graphics card comparison? We answer this question using five indices: the overall score as well as the individual indices for the four resolutions. The overall score is known as the PCGH performance index and combines the four test resolutions at 25 percent each, without any weighting. Prior normalization of the fps values ensures that large numbers carry the same weight as small ones.
Graphics cards marked with "NA" were tested only in 1080p, which is why only the Full HD performance index is available here.
The Radeon RX 9070 GRE is 31 percent faster than the Radeon RX 9060 XT 16GB and 13 percent slower than the Radeon RX 9070. The Geforce RTX 5070 is six percent ahead of AMD's latest card. This is not a huge gap, but it is a clear one. The Radeon RX 9070 GRE performs best in Full HD, where the gaps to the RX 9070 and RTX 5070 are at their smallest. For context: The Radeon RX 9070 GRE sits on the same performance level as older graphics cards such as the Radeon RX 6950 XT, Radeon RX 7900 GRE, Geforce RTX 3090, or Geforce RTX 4070 Super.
Radeon RX 9070 GRE: Resolution scaling
Let us take a look at how performance scales with resolution. Put differently: What happens when the Radeon RX 9070 GRE is subjected to increasingly higher loads? The following benchmark shows its behavior from Full HD to Ultra HD, thereby also providing a discreet glimpse into the future. It makes it immediately clear which graphics cards see particularly strong or weak performance drops.
The Radeon RX 9070, RX 9070 GRE, and Geforce RTX 5070 scale almost identically, meaning high pixel loads are generally not a problem. The Radeon RX 9060 XT 16GB shows different behavior due to its small cache and significantly reduced memory transfer rate. Both factors make higher resolutions somewhat more costly, even though the memory capacity itself is entirely sufficient.
Radeon RX 9070 GRE vs. 81 other graphics cards
Finally, we would like to give you a look at the bigger picture: the special rasterization performance index, which combines older and newer PCGH indices. This allows you to better assess whether upgrading your graphics card is worthwhile. Here is the current ranking, including the Radeon RX 9070 GRE:
Had the Radeon RX 9070 GRE been released six years ago, it would have become the new queen. In mid-2026, performance on the level of a Geforce RTX 3090 no longer sparks the same level of excitement, but everyday gaming is still highly enjoyable with this class of performance. The Radeon RX 9070 GRE is a strong upgrade option for many users. Whether the same also applies to ray tracing, as visually attractive as it is demanding, is what we examine on the following page.
- Page 1 Overview and specifications
- Page 2 Game benchmarks and performance index
- Page 3 Ray tracing benchmarks and performance index
- Page 4 Path tracing benchmarks and performance index
- Page 5 Power consumption and efficiency
- Page 6 Price-performance ratio in rasterization & ray tracing, & conclusion