"Arc B780" DIY Build: Gaming Benchmarks and Performance Index
Gaming Performance, Part 1 - Rasterization
Inhaltsverzeichnis
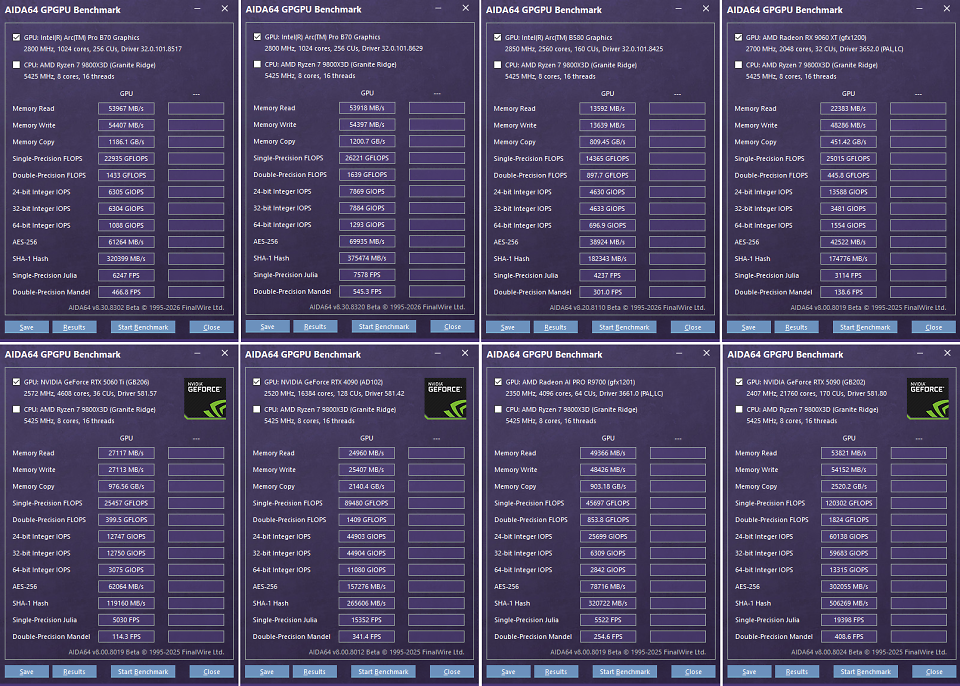
How does Intel's top-of-the-line graphics card perform in rasterized games, modern ray-tracing blockbusters, and groundbreaking path-tracing titles? To answer this question, we put Intel's best graphics card through our 2026 GPU benchmarks. The 20 rasterization tests, 15 ray-tracing tests, and 7 path-tracing tests deliver highly exciting results. Meanwhile, AIDA64's General Purpose GPU Benchmark provides an initial overview of the throughput rates to better assess the test subjects:
 Source: PC Games Hardware
AIDA64 GPGPU Benchmark: Arc Pro B70 vs. "Arc B780" vs. Arc B580 vs. RX 9060 XT 16GB vs. RTX 5060 Ti 16GB vs. RTX 4090 vs. AI Pro R9700 vs. RTX 5090 (Click to enlarge)
Source: PC Games Hardware
AIDA64 GPGPU Benchmark: Arc Pro B70 vs. "Arc B780" vs. Arc B580 vs. RX 9060 XT 16GB vs. RTX 5060 Ti 16GB vs. RTX 4090 vs. AI Pro R9700 vs. RTX 5090 (Click to enlarge)
GPU Benchmarks 2026
Here's how we conduct our tests: Every published figure represents an average of three—and in some cases four—runs per resolution; outliers are excluded. That amounts to at least twelve measurements per game, or 240 per graphics card, just for the rasterization performance index. In other words, the benchmark results you see are the aggregate of approximately 16,000 individual measurements.
Since the GPU clock speed of a single graphics card varies during testing, we report the average clock speed across all resolutions (calculated by our measurement tool CapFrameX). For example, if a graphics card operates at dynamic frequencies between 3,000 and 3,200 MHz, this results in a value of "~3.10 GHz." Rule of thumb: If a graphics card is the limiting factor—and thus the sole determinant of the frame rate—the GPU boost decreases as the resolution increases.
DIY Arc B780: Gaming Benchmarks
As always, you can choose between four resolutions for our benchmarks: Full HD, WQHD, Ultrawide QHD, and Ultra HD, which you can switch between in the gray dropdown menu on the left in each game. This time, WQHD (2,560 × 1,440 pixels) is selected by default, matching the processing power of our test system. Important: The 2026 rasterization benchmarks are also consistently run at native resolution—without any upscaling. This not only addresses numerous requests from readers and viewers but also allows us to best highlight the performance differences between graphics cards. If you play with upscaling, you can generally expect higher frame rates. For example, if you're gaming in Ultra HD with quality upscaling, you can use the WQHD values shown here as a great reference (overview of the internal resolutions resulting from upscaling). The rasterization results:
If you wish, you can display up to 16 additional graphics cards for each game; we have hidden them for the sake of clarity.
Compared to the Arc Pro B70, our "Arc B780" delivers a 9 to 24 percent performance boost in WQHD. This wide range is easily explained: Overclocking is particularly effective when the reference card is severely power-limited and consequently has to throttle down. Scaling beyond 20 percent occurs in cases where the Intel card operates at less than 2.5 GHz. In games that do not push the Arc Pro B70's 230-watt limit to its limits, however, the overclocked card does not stand out significantly. This applies primarily to low resolutions, including Full HD. High resolutions, such as Ultra HD, are particularly power-intensive, so the overclocked card performs best here. The UHD results are particularly impressive in Atomfall, Cyberpunk 2077, Dying Light The Beast, Kingdom Come Deliverance 2, and Space Marine 2.
"Arc B780" in the performance index
How does the heavily overclocked Intel graphics card stack up in comparison? We answer this question using five metrics: the overall score and the individual scores for the four resolutions. The overall score is known as the PCGH Performance Index and calculates the four test resolutions, each accounting for 25 percent (no weighting is applied). The prior normalization of the FPS values ensures that large numbers carry the same weight as small ones.
That's impressive: The "Arc B780" outperforms the Arc Pro B70 by an average of 17 percent, and by as much as 18 percent in Ultra HD. While this allows the card to outperform the Radeon RX 7800 XT, GeForce RTX 3080, and their peers, even our little overclocking marvel stands no chance against a GeForce RTX 5070 or Radeon RX 9070—though it does match their performance levels in some games. At least we can push the big Battlemage within striking distance of the Radeon RX 9070 GRE. For even more, a water cooler along with a custom clock/voltage curve would be necessary. Find out if the tide is turning in ray tracing on the following page.


